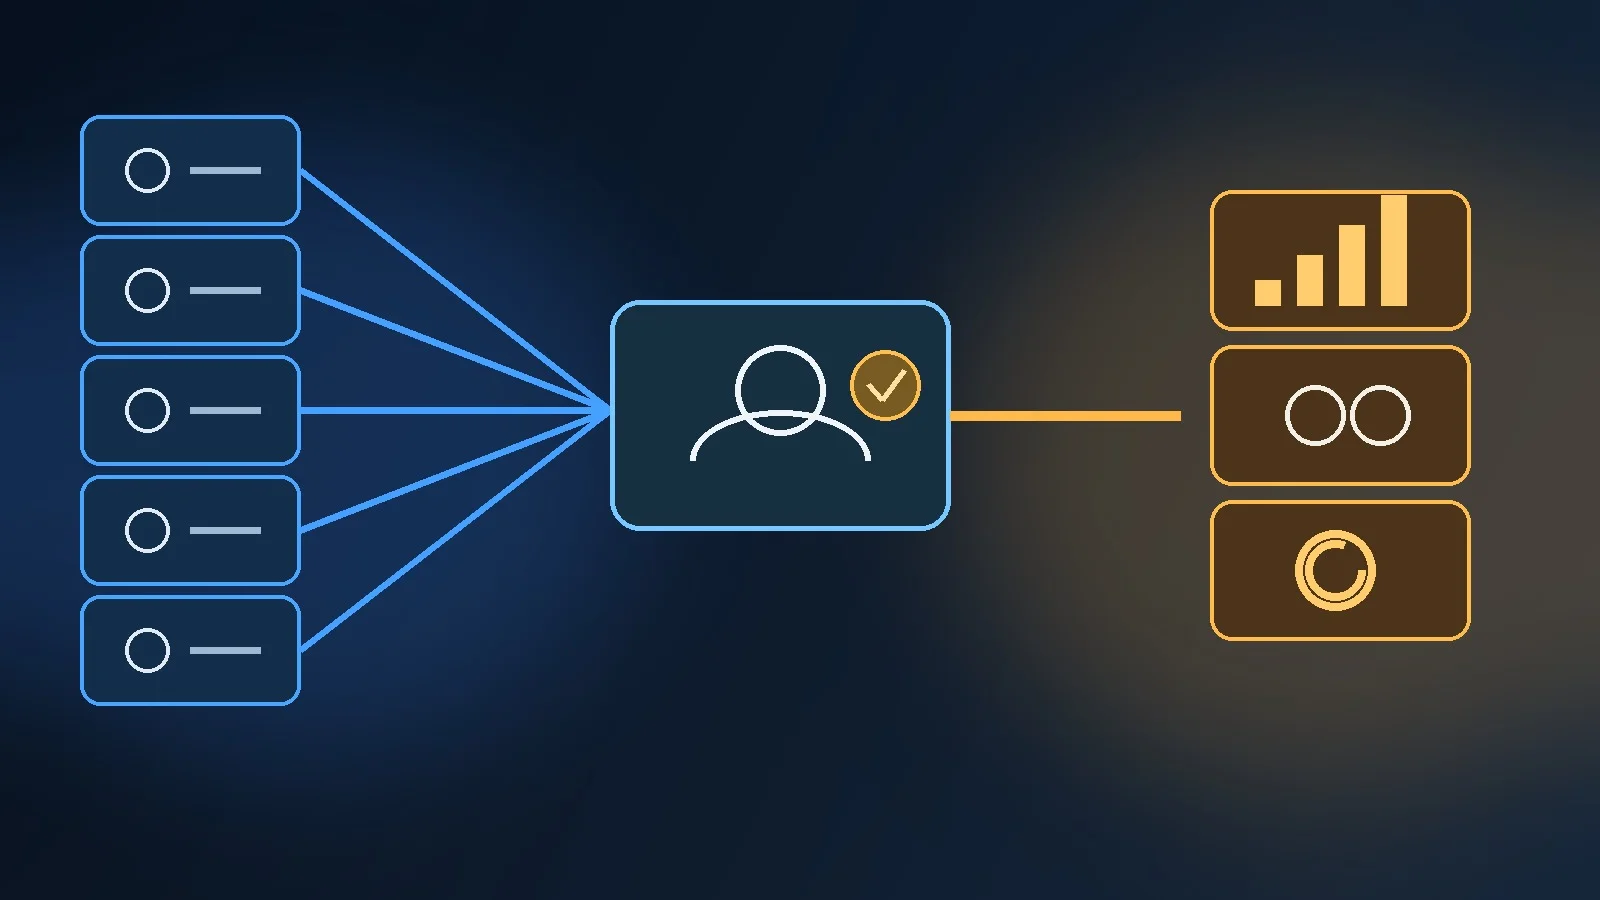
Measurement becomes overwhelming when marketers start with tools.
GA4 has reports. Advertising platforms have attribution. CRM has pipeline. The warehouse has raw events. Finance has revenue.
The measurement operator’s job is to make these systems answer coherent business questions.
This learning path teaches a hierarchy-first approach: define decisions and outcomes, then metrics, events, identifiers and reporting.
Prerequisites
You should understand:
- basic funnel math;
- CAC and LTV;
- percentages and cohorts;
- the main customer lifecycle.
Recommended:
- Marketing Analytics: From Data to Decisions That Drive Growth;
- The Modern Analytics & Measurement Stack: From Events to Decisions.
Learning outcomes
By the end, you should be able to:
- build a metric hierarchy;
- distinguish outcome, input and guardrail metrics;
- define a North Star candidate;
- create an event dictionary;
- map identifiers across systems;
- build funnel and cohort analyses;
- explain attribution limitations;
- use unit economics in marketing decisions;
- create a weekly decision review;
- identify measurement failure modes.
Module 1 — Start with decisions
Read Marketing Analytics.
Do not begin with:
What should the dashboard show?
Begin with:
Which recurring decisions are currently made with weak evidence?
Examples:
- increase or reduce channel spend;
- change target segment;
- prioritize onboarding work;
- refresh or retire content;
- change price;
- scale an experiment.
Exercise
List five recurring marketing decisions.
For each, define:
- primary evidence;
- owner;
- cadence;
- cost of being wrong.
The most expensive decisions deserve the strongest measurement.
Module 2 — Build a metric hierarchy
Create four levels.
Business outcomes
- revenue;
- profit;
- retained revenue;
- pipeline.
Unit economics
- CAC;
- LTV;
- payback;
- contribution margin.
Behavioral outcomes
- activation;
- qualified conversion;
- repeat purchase;
- retention.
Operational signals
- impressions;
- clicks;
- CPC;
- sessions.
The hierarchy protects the organization from optimizing a lower-level metric at the expense of a higher-level outcome.
Smartlook’s case is a good example: signup conversion improved while activation weakened.
Module 3 — Define a North Star carefully
Amplitude recommends starting from the customer’s value moment and expressing it as measurable behavior. Its 2026 guidance also emphasizes validating that the candidate predicts retention and revenue.
Reforge uses a related but somewhat broader framework that separates high-level acquisition, retention and monetization outcomes from input metrics.
The terminology differs.
The shared operating principle is useful:
choose outcome metrics that represent real value, then identify actionable inputs.
Exercise
Propose one North Star candidate.
Evaluate it:
- Does it represent customer value?
- Can teams influence it?
- Is it leading enough to guide action?
- Does it correlate with retention?
- Does it connect to economics?
- Could optimizing it create a bad incentive?
Then define three input metrics.
Module 4 — Build the event dictionary
Events should represent business behavior.
Examples:
- `view_pricing`;
- `generate_lead`;
- `sign_up`;
- `activate_workspace`;
- `begin_checkout`;
- `purchase`;
- `renew_subscription`.
For every event define:
- event name;
- business definition;
- trigger;
- parameters;
- source;
- owner;
- funnel stage.
Exercise
Take the top ten events in your analytics property.
Ask:
- Do we know exactly what fires each one?
- Is the event still used?
- Does the event have an owner?
- Does it support a metric?
Remove or deprecate noise.
Module 5 — Map identity across systems
Read Analytics & Measurement Stack and focus on identity.
The customer may exist as:
- anonymous web ID;
- logged-in user ID;
- CRM lead ID;
- account ID;
- order ID;
- transaction ID.
Cross-system analysis depends on how these states connect.
Exercise
Draw the identifier lifecycle from first anonymous touch to revenue.
Mark:
- where identity becomes known;
- where systems create a new ID;
- where joins are possible;
- where consent or privacy constraints apply.
This diagram is often more valuable than another dashboard.
Module 6 — Learn funnel and cohort analysis
Funnels answer:
Where does progression break?
Cohorts answer:
How does behavior change for groups that started under different conditions?
Use both.
Funnel dimensions
- volume;
- conversion;
- velocity;
- value.
Cohort dimensions
- acquisition month;
- channel;
- plan;
- geography;
- activation path.
Exercise
Build one funnel and one retention cohort table.
Then write three observations without proposing solutions.
Separate observation from interpretation.
This reduces confirmation bias.
Module 7 — Understand unit economics
Read CAC, LTV and Payback.
A marketing measurement system that cannot connect acquisition to economics is incomplete.
Exercise
For each major channel, calculate or estimate:
- CAC;
- gross-margin-adjusted LTV;
- payback;
- 90-day retention or relevant repeat behavior.
Then compare average and marginal acquisition cost.
A channel can look efficient on average while the next unit of spend is unattractive.
Module 8 — Treat attribution as a model
Attribution distributes credit.
It does not automatically measure incrementality.
Use attribution to understand paths and operational patterns.
For large allocation decisions, supplement it with:
- holdouts;
- geo tests;
- lift studies;
- controlled experiments;
- marginal spend analysis.
Exercise
Choose one recent conversion.
Write three plausible attribution stories:
- last click;
- first discovery;
- assisted journey.
Then ask which decision would change under each story.
This reveals why attribution is not neutral.
Module 9 — Add guardrails
Optimization creates side effects.
Examples:
Primary signup conversion
Guardrail activation
Primary checkout completion
Guardrail refund rate
Primary lead volume
Guardrail qualified lead rate
Guardrails prevent local optimization.
Exercise
For the five recurring decisions from Module 1, add one guardrail each.
Module 10 — Build a decision review
A weekly analytics meeting should not be a dashboard tour.
Use:
1. Outcome
What changed materially?
2. Driver
Which segment or stage explains it?
3. Confidence
Is the data trustworthy?
4. Decision
What changes?
5. Validation
How will we know whether the change worked?
Exercise
Run the format on one historical week.
If the meeting produces no decisions repeatedly, simplify the reporting.
Final project — Build the measurement operating system

Your final document should include:
Metric tree
- one primary outcome;
- three input metrics;
- two guardrails.
Funnel
- stages;
- conversion;
- velocity;
- value.
Event dictionary
- ten critical events.
Identity map
- anonymous to revenue.
Economics
- CAC;
- LTV;
- payback.
Decision cadence
- weekly;
- monthly;
- quarterly.
Measurement risks
List the five highest-risk failure modes.
Examples:
- missing events;
- duplicate conversions;
- CRM mismatch;
- attribution overconfidence;
- stale metric definitions.
Suggested cadence
Day 1: decision questions
Day 2: metric hierarchy and North Star
Day 3: events and identity
Day 4: funnel and cohorts
Day 5: unit economics
Day 6: attribution and guardrails
Day 7: build the operating system
What to study next
Measurement is not a terminal specialization.
Use it to improve every other learning path.
Return to acquisition with better channel economics.
Return to lifecycle with better cohort definitions.
Return to experimentation with better primary and guardrail metrics.
The purpose of measurement is not to create certainty.
It is to reduce uncertainty enough that the organization can make better decisions, detect when assumptions are wrong and learn faster.
Build a metric contract
A metric should have an explicit contract before it becomes a company KPI.
Document:
- name;
- business meaning;
- formula;
- numerator;
- denominator;
- included population;
- excluded population;
- source system;
- update frequency;
- owner;
- known limitations.
For example, “CAC” can mean very different things depending on whether the calculation includes:
- media only;
- agency fees;
- sales salaries;
- marketing salaries;
- creative production;
- discounts.
Two teams can use the same acronym and produce different decisions.
The metric contract removes ambiguity.
Exercise
Choose three metrics used in leadership reporting.
Ask two people independently how each is calculated.
If the answers differ, the organization has a governance problem.
Confidence levels for marketing evidence
Not every number deserves the same confidence.
Create a simple evidence scale.
High confidence
Examples:
- settled revenue from billing;
- verified orders;
- controlled experiment.
Medium confidence
Examples:
- CRM attribution;
- modeled LTV;
- cohort-based forecast.
Directional
Examples:
- platform attribution;
- survey intent;
- view-through conversions;
- assisted-conversion reports.
The objective is not to dismiss directional data.
It is to prevent directional evidence from being presented with the certainty of a ledger.
Exercise
Tag the main metrics in your weekly dashboard:
- high confidence;
- medium confidence;
- directional.
Then identify where a major budget decision currently depends on low-confidence evidence.
That becomes a measurement-improvement priority.