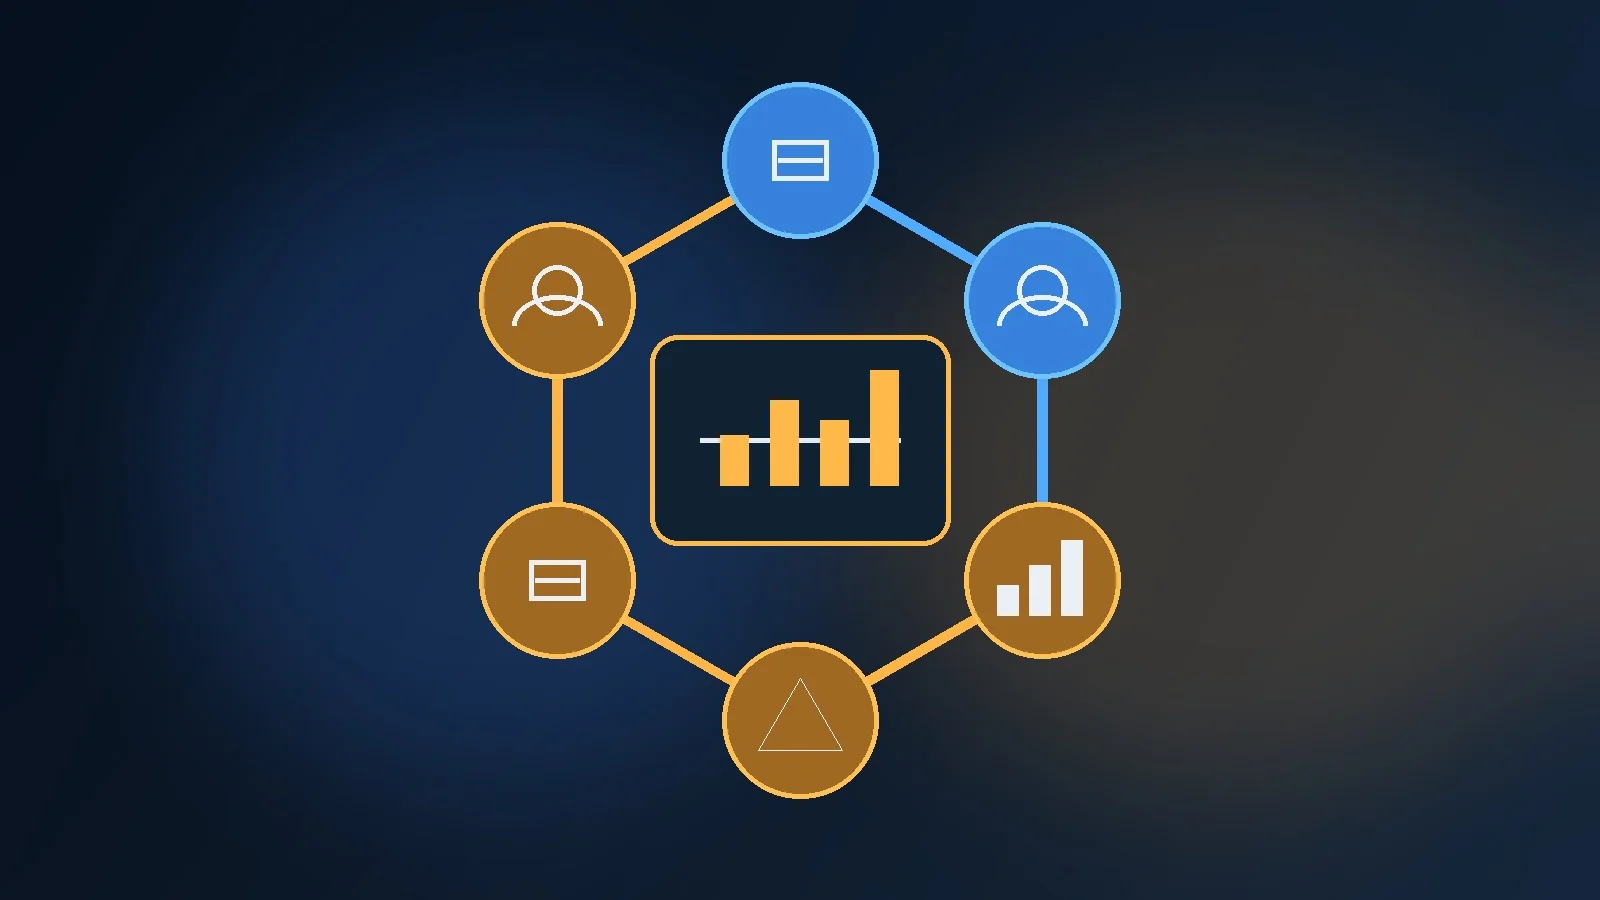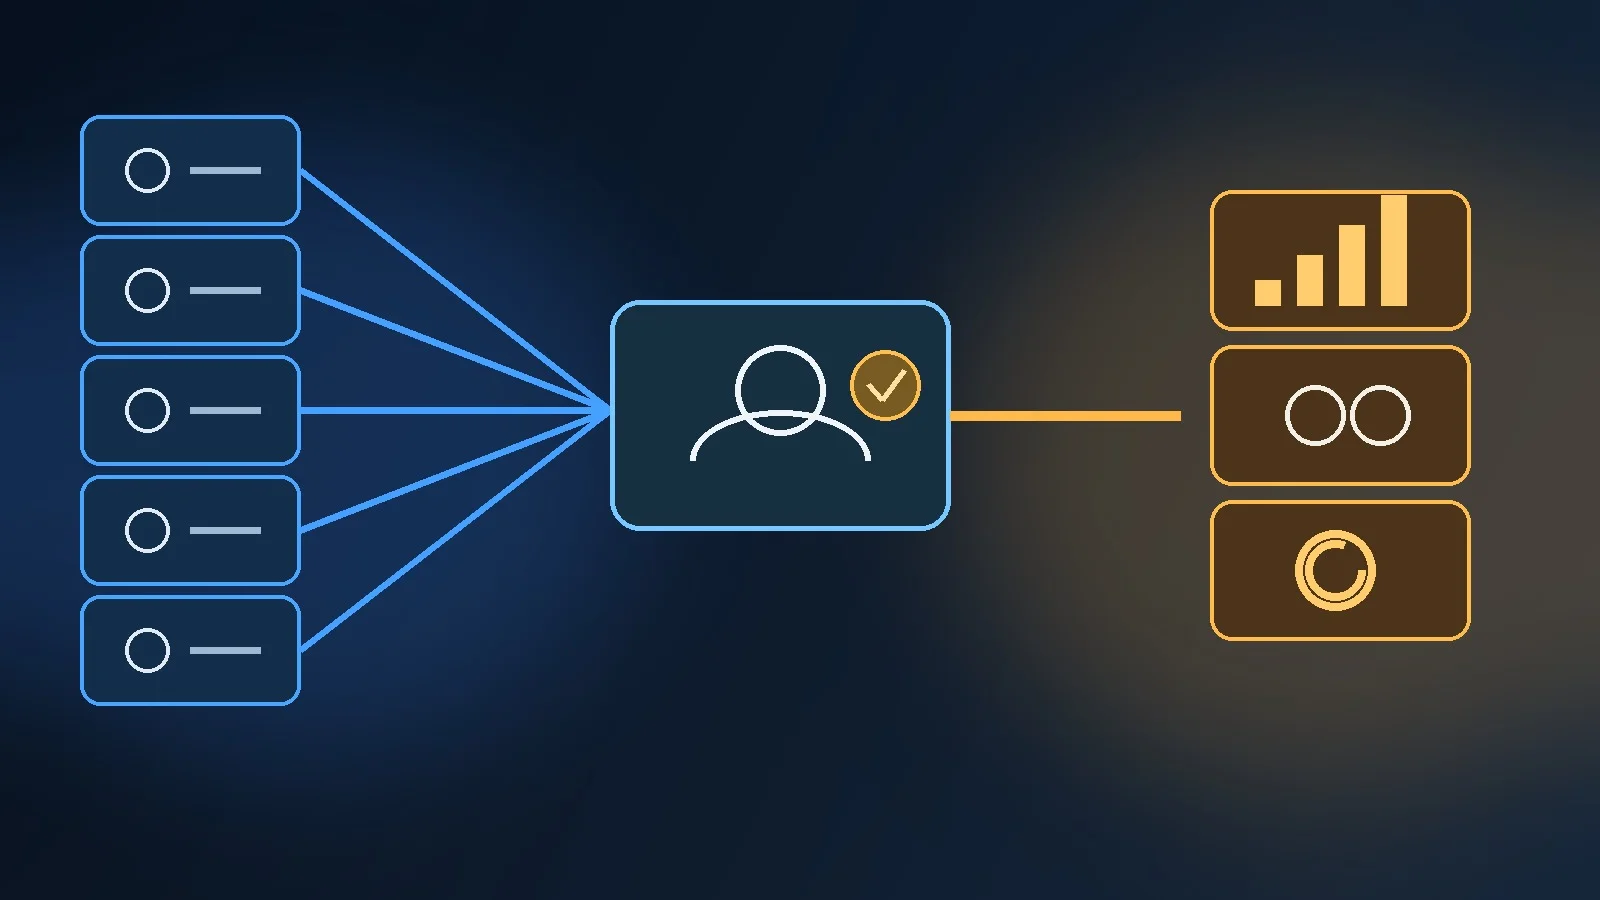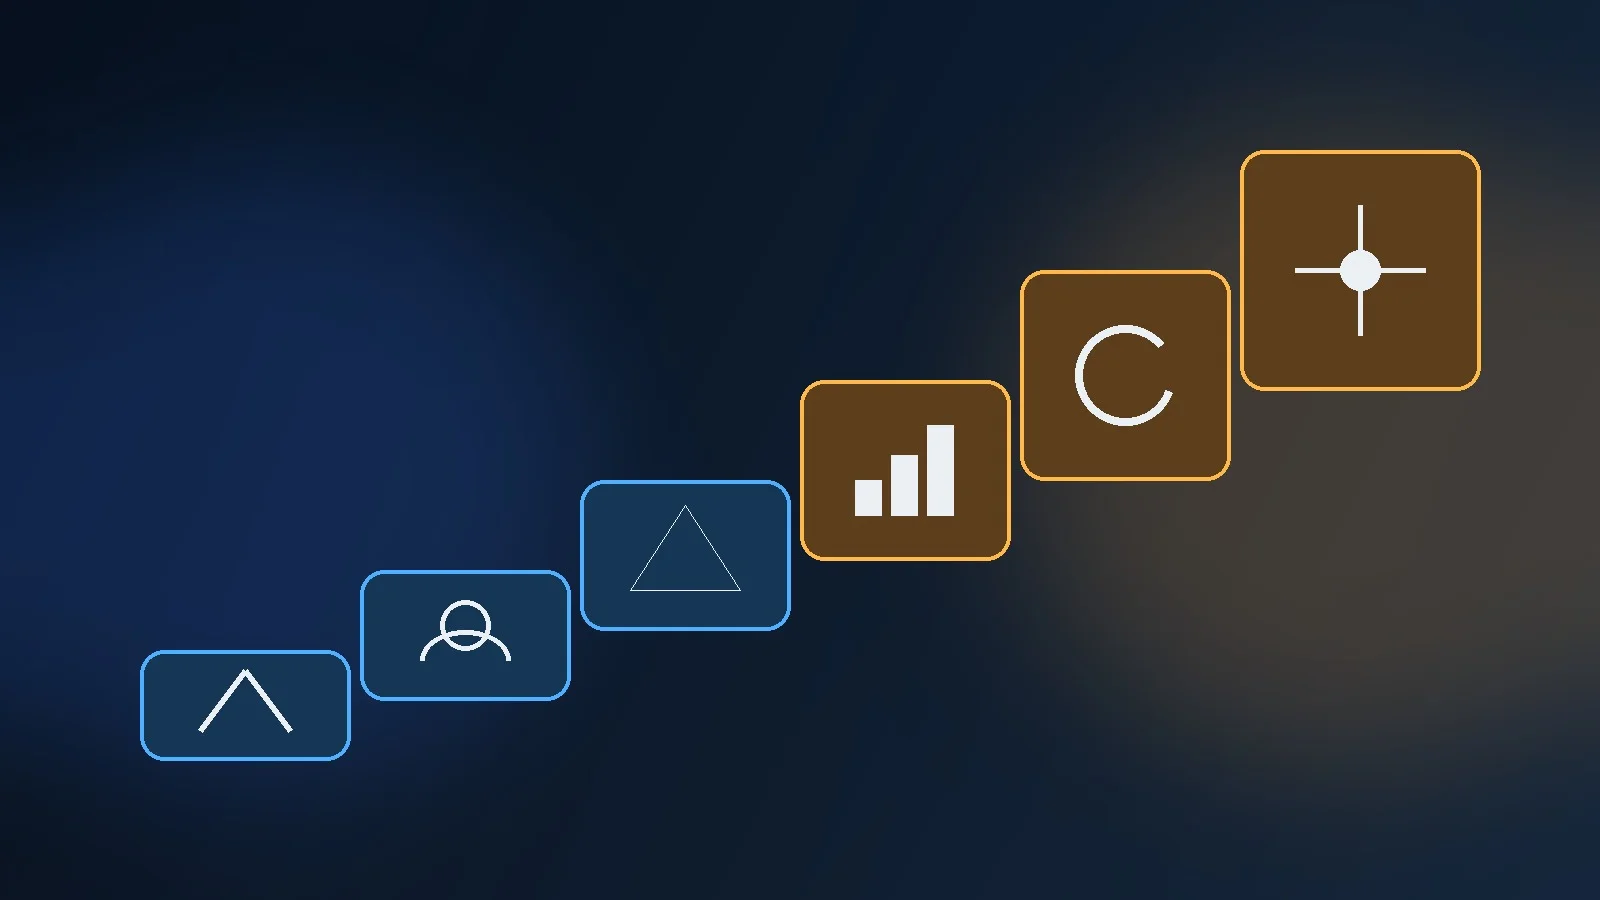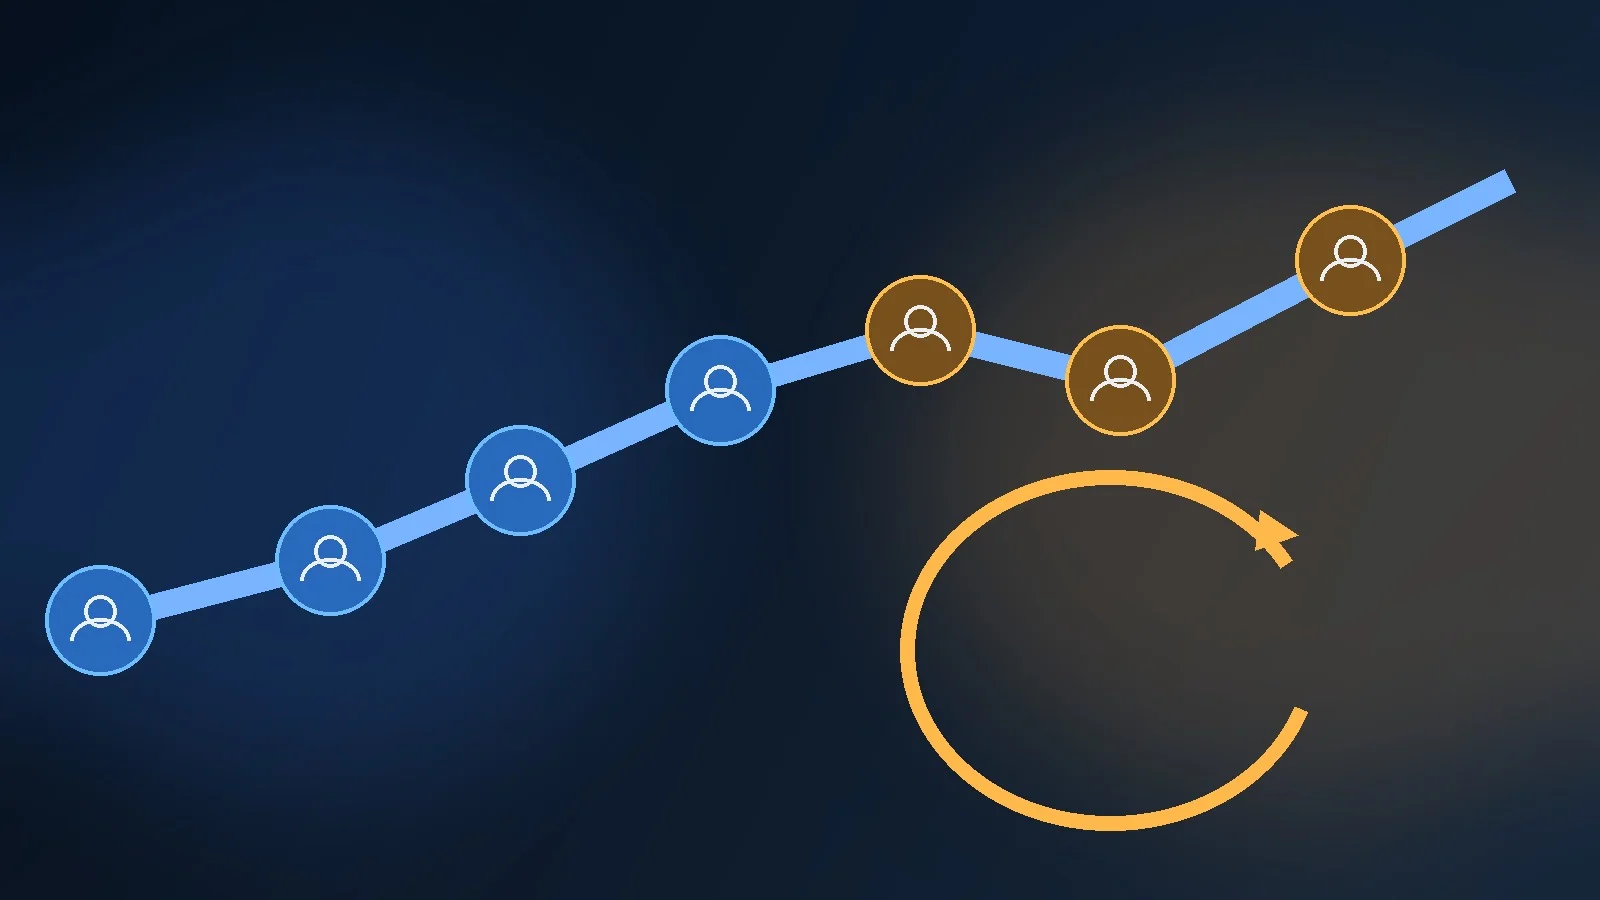
Funnels become useful when they stop being presentation slides and start functioning as lifecycle infrastructure.
This learning path focuses on the customer journey after the first touch: progression, activation, retention, lifecycle messaging and expansion.
It is designed for growth, CRM, lifecycle, product-marketing, SaaS and ecommerce operators.
The objective is to build a system where marketing, sales, product and automation share the same definitions of customer state.
Prerequisites
Complete or understand:
- AARRR Funnel;
- Marketing and Sales Funnels;
- basic analytics and conversion-rate math.
You should know the difference between a visit, a conversion and an activated customer.
Learning outcomes
At the end, you should be able to:
- define lifecycle stages using observable behavior;
- distinguish signup from activation;
- identify a funnel constraint;
- measure volume, conversion, velocity and value;
- create retention cohorts;
- design event-driven lifecycle automation;
- prevent contradictory journeys;
- connect retention to LTV and acquisition economics;
- build a lifecycle scorecard.
Module 1 — Build the lifecycle map
Start with Marketing and Sales Funnels.
Define your business lifecycle.
For a SaaS product:
`visitor → lead/signup → activated → paid → retained → expanded`
For ecommerce:
`visitor → product intent → checkout → purchase → repeat purchase → loyal customer`
For B2B:
`qualified visit → lead → qualified lead → opportunity → customer → adoption → renewal/expansion`
Use only the stages that change a decision.
Exercise
For every stage, document:
- entry event;
- exit event;
- owner;
- source system;
- expected maximum time in stage.
If “engaged” has no event definition, remove it or define it.
Module 2 — Identify activation
Activation is the transition from access to first meaningful value.
This is frequently confused with signup.
Read Smartlook: Why a 70%+ Signup Conversion Rate Was Not the Metric That Mattered.
Smartlook’s case shows how optimizing account creation can conflict with activation.
Activation questions
Ask:
- What must the user accomplish before they understand the product’s value?
- How long should that take?
- Which behaviors predict later retention?
- Which setup actions are genuinely necessary?
Exercise
Create an activation statement:
A new customer is activated when [user/account] completes [core behavior] within [time window].
Then test the statement against retained and churned cohorts.
A good activation metric should be predictive enough to guide onboarding.
Module 3 — Measure funnel health beyond conversion
For each transition, measure four things.
Volume
How many users/accounts enter?
Conversion
What percentage progress?
Velocity
How quickly?
Value
What is the downstream quality or economic value?
A lifecycle can have a healthy conversion rate and poor velocity.
An enterprise funnel can have low volume and exceptional value.
Exercise
Pick one stage.
Calculate:
- stage volume;
- conversion to next stage;
- median time to next stage;
- downstream value.
Then segment by:
- source;
- cohort;
- plan;
- geography;
- device.
Module 4 — Retention is a curve, not one number
Read Pangea: When a Retention Problem Forced a Business Model Pivot.
The important idea is diagnostic escalation.
If retention is structurally weak, the problem might be:
- onboarding;
- use case;
- market;
- audience;
- product;
- business model.
Do not assume lifecycle messaging can fix all retention problems.
Cohort exercise
Create monthly or weekly acquisition cohorts.
Track the core behavior over the product’s natural frequency.
Examples:
- daily;
- weekly;
- monthly;
- renewal cycle.
Look for:
- early drop;
- stabilization;
- segment differences;
- changes between newer and older cohorts.
Module 5 — Connect retention to economics
Retention affects:
- LTV;
- payback;
- acquisition capacity;
- expansion;
- referrals.
Reforge has argued that retention sits at the center of the growth model because it changes the economics of acquiring customers and can strengthen virality or other loops.
Read CAC, LTV and Payback again with a retention lens.
Exercise
Model two retention scenarios.
Keep CAC constant.
Change only retention.
Observe:
- LTV;
- payback;
- allowable CAC;
- contribution margin.
This shows why retention is not merely a “product metric.”
Module 6 — Build event-driven lifecycle automation
Read Marketing Automation Stack: How to Orchestrate Journeys Without Losing Control.
Lifecycle automation should be built around state transitions.
Examples:
- signup → activation journey;
- abandoned checkout → recovery;
- lead → qualification;
- trial → paid;
- renewal approaching → account action;
- inactive → reactivation.
The key design principle is exit logic.
A customer should stop receiving onboarding once activated.
A lead should leave nurture once an opportunity opens.
A buyer should not receive abandoned-cart messaging after purchase.
Exercise
Design one journey using:
- trigger;
- eligibility;
- branch;
- action;
- wait;
- exit;
- conversion;
- guardrail.
Then identify which system confirms each state.
Module 7 — Add frequency and suppression control
Customers experience all campaigns together.
The organization sees them separately.
This creates collision risk.
A customer may qualify simultaneously for:
- onboarding;
- promotion;
- renewal;
- cart recovery;
- product announcement.
Design global rules for:
- priority;
- frequency;
- quiet periods;
- consent;
- transactional exceptions;
- sales ownership.
Exercise
Create a contact-policy matrix.
Example:
- New trial — Allowed: onboarding · Suppressed: promotions · Priority: activation
- Open opportunity — Allowed: sales support · Suppressed: generic nurture · Priority: sales
- Current customer — Allowed: education/expansion · Suppressed: acquisition offer · Priority: customer value
Module 8 — Use friction intentionally
Return to the Smartlook case.
Then compare it with TruckersReport: Six CRO Tests That Lifted Landing Page Conversion 79.3%.
Both cases show that “less friction” is not a universal principle.
Friction can be useful when it:
- improves qualification;
- collects decision-critical information;
- prevents errors;
- increases commitment;
- enables personalization.
The correct question is:
Does this step improve the economics or quality of the full lifecycle?
Module 9 — Connect pricing to lifecycle behavior
Read Ladder: How Pricing Research Helped Turn Paid Acquisition Into Growth.
Pricing influences:
- conversion;
- commitment;
- retention;
- customer expectations;
- acquisition tolerance.
Lifecycle strategy therefore cannot be separated completely from monetization.
Exercise
For one plan or offer, map:
`price → conversion → activation → retention → LTV`
Identify where a pricing change could create second-order effects.
Final project — Build a lifecycle operating map
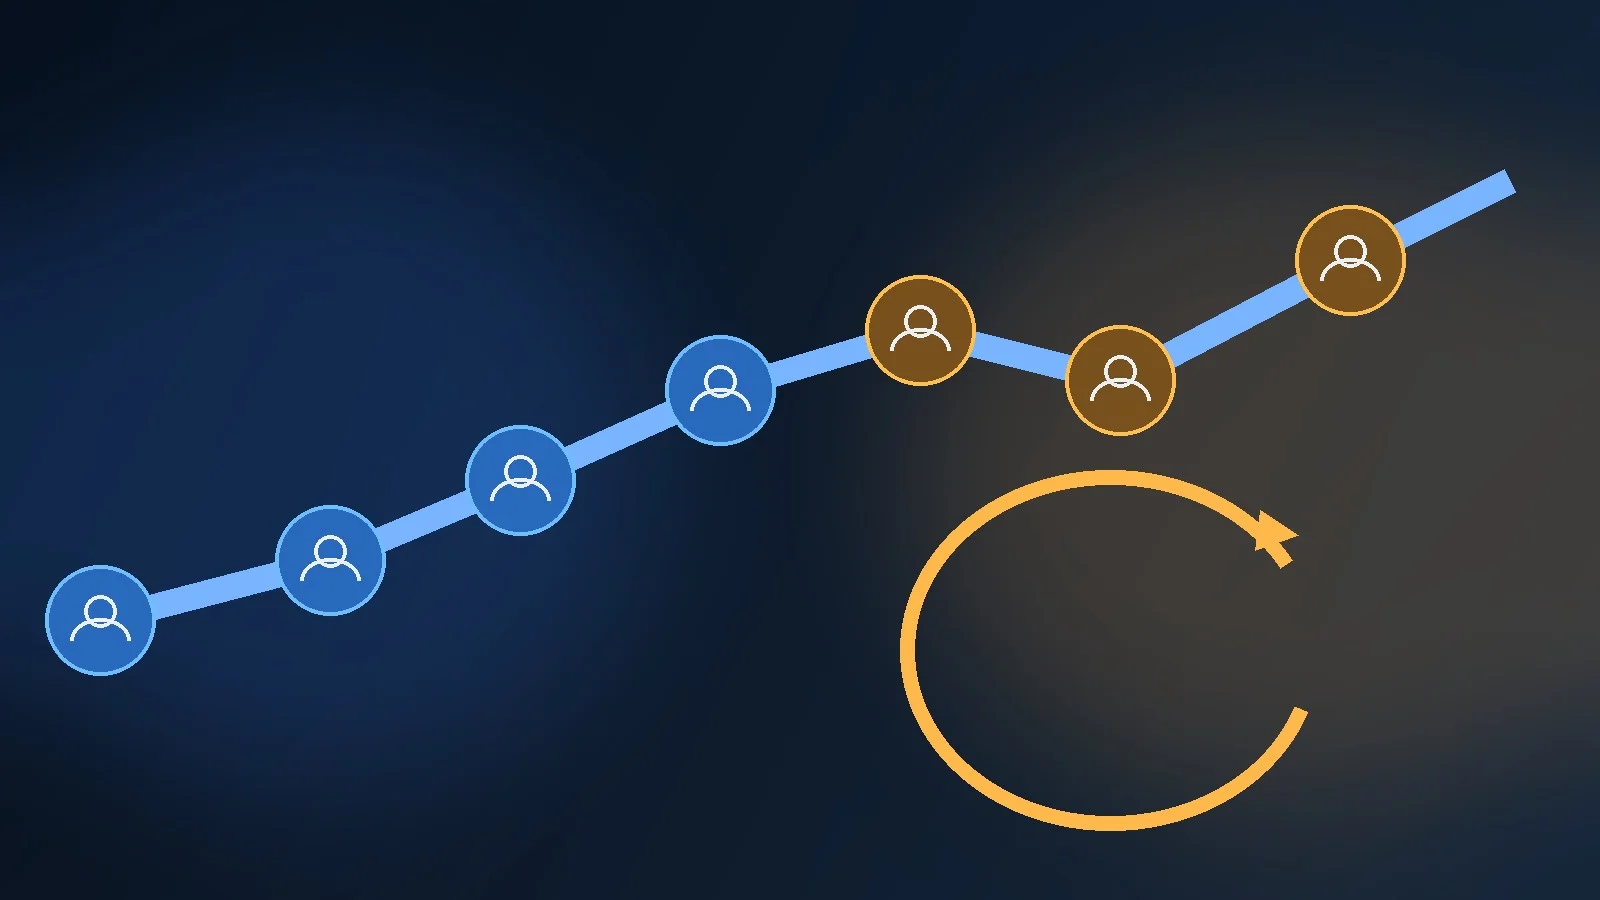
Create one document containing:
Stages
- state;
- entry event;
- exit event;
- owner.
Activation
- definition;
- time window;
- leading indicators.
Retention
- cohort frequency;
- retained behavior;
- target curve or threshold.
Automation
- three priority journeys;
- suppression rules;
- exits.
Metrics
- conversion;
- velocity;
- value;
- retention;
- lifecycle revenue.
Experiments
Select two lifecycle hypotheses.
Examples:
- reduce time to activation;
- improve renewal preparation;
- remove low-value onboarding friction.
Suggested study cadence
Day 1: lifecycle map
Day 2: activation and Smartlook
Day 3: funnel health
Day 4: retention and Pangea
Day 5: automation
Day 6: suppression and journey governance
Day 7: economics and final lifecycle map
What to study next
If the lifecycle is clear and stable, move to Growth & Experimentation to improve it systematically.
If you are uncertain about event definitions or cohort measurement, move to Measurement & Metrics.
Funnels are not the goal.
The goal is to make customer state visible enough that the organization can create the right experience, measure the right transition and intervene at the right moment.
Lifecycle maturity: move from campaigns to state management
Lifecycle programs typically evolve through three stages.
Campaign-led
The team sends:
- newsletters;
- promotions;
- onboarding sequences.
The programs are calendar-driven.
Trigger-led
Customer behavior starts to control timing.
Examples:
- signup;
- abandonment;
- activation;
- inactivity;
- renewal.
State-led
The organization maintains an explicit model of customer state across marketing, product and sales.
Messages and actions depend on:
- current lifecycle stage;
- eligibility;
- account ownership;
- recent behavior;
- consent;
- frequency.
This is the most robust model because it reduces contradictory communication.
Exercise
Pick one current campaign and rewrite it as a state transition.
Instead of:
Send onboarding email three days after signup.
Use:
If the customer has signed up, has not reached the activation event within 72 hours, remains eligible for lifecycle email and has not entered a sales-owned state, send the activation intervention.
The second version is operationally more precise.
Lifecycle handoff audit
Lifecycle breakdowns often happen between teams rather than within a single journey.
Audit these handoffs:
- marketing → sales;
- sales → onboarding;
- onboarding → product adoption;
- product adoption → renewal;
- support → retention;
- customer success → expansion.
For each handoff, document:
- trigger;
- required context;
- receiving owner;
- expected response time;
- feedback returned upstream.
A lifecycle is only as reliable as its least visible handoff.