Growth is often taught as a collection of tactics.
Referral program. A/B test. New channel. Viral mechanic. Pricing experiment.
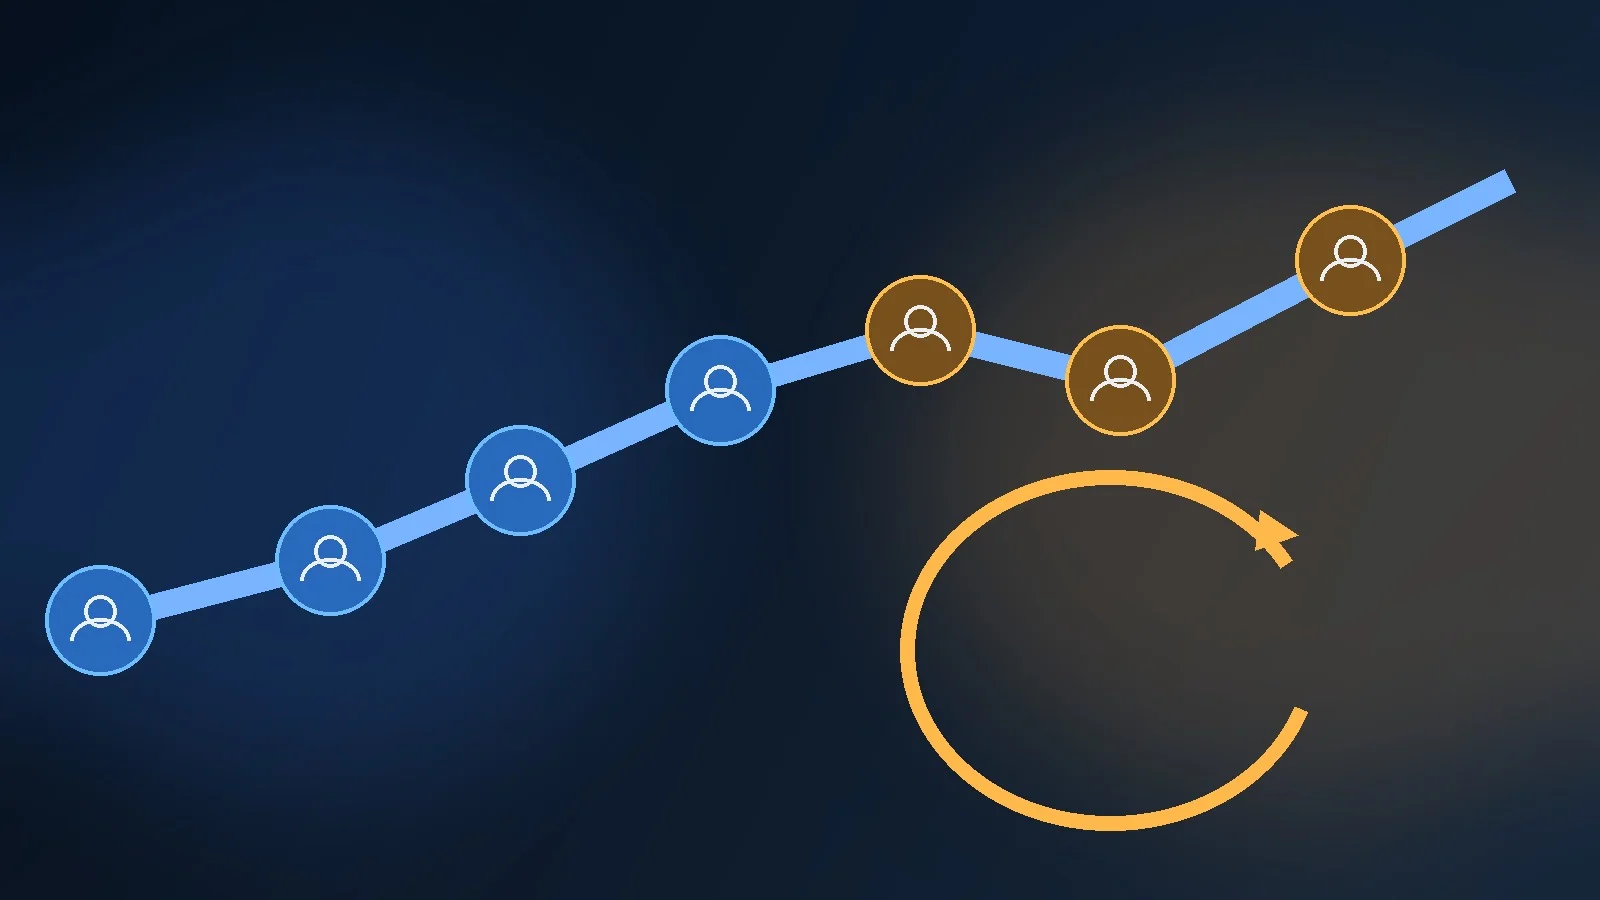
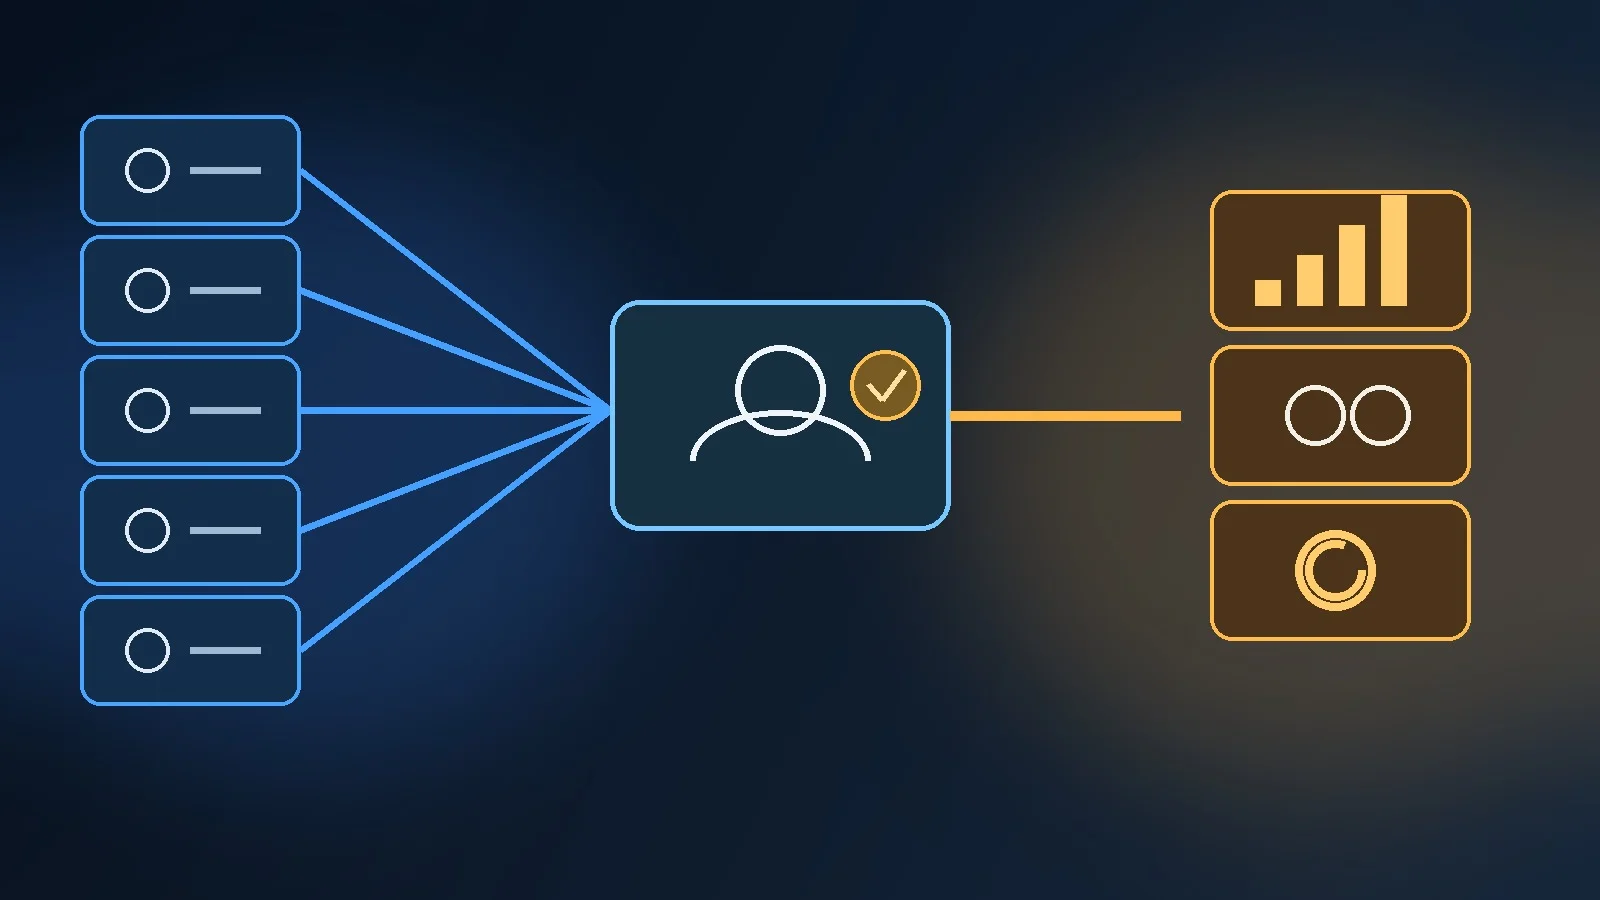
This learning path teaches a different model: growth as a system of loops, metrics, hypotheses and cross-functional learning.
It is designed for operators who already understand funnels and want to move from local optimization toward compounding systems.
Prerequisites
You should understand:
- AARRR;
- funnel stages;
- activation and retention;
- basic CAC/LTV economics;
- conversion-rate measurement.
Recommended prior reading:
Learning outcomes
At the end, you should be able to:
- distinguish funnels from loops;
- map a growth loop;
- identify loop speed and weak edges;
- separate optimization from strategic experimentation;
- write falsifiable hypotheses;
- prioritize by learning value;
- choose primary and guardrail metrics;
- interpret negative experiments;
- build an experiment library;
- connect growth work to business outcomes.
Module 1 — Move from funnel thinking to system thinking
Read Growth Loops.
Funnels are useful for diagnosing progression.
Loops answer a different question:
How does the output of one cycle create input for the next?
Examples:
Referral loop
customer → invite → new user → activation → new invite
Content loop
user/content creation → discovery → new user → more content
Paid reinvestment loop
spend → customer → margin → reinvested spend
Marketplace loop
more supply → better demand experience → more demand → more supply
Exercise
Choose one growth mechanism.
Define:
- input;
- action;
- output;
- reinvestment;
- conversion at each edge;
- cycle time.
If the output does not feed the next input, you have a process, not a loop.
Module 2 — Measure loop strength and speed
A loop can be weak for two reasons:
- low conversion;
- slow cycle time.
Suppose two referral loops produce the same number of successful invites per user.
One cycles every three days. One cycles every 30 days.
The first can compound faster.
Exercise
For the loop you mapped, write:
- Input → action — Conversion: · Time:
- Action → output — Conversion: · Time:
- Output → new input — Conversion: · Time:
Select the weakest edge.
That becomes a candidate growth problem.
Module 3 — Learn the difference between optimization and experimentation
CXL distinguishes growth experiments from optimization and A/B testing.
That distinction matters.
Optimization
Improve an existing system where the problem and objective are relatively clear.
Example:
- improve checkout completion.
Experimentation
Resolve uncertainty around a strategic assumption.
Example:
- test whether a different segment has materially stronger retention.
A/B testing
One method for controlled comparison.
It can support either optimization or experimentation.
Exercise
Take ten items from your growth backlog.
Classify them:
- optimization;
- strategic experiment;
- instrumentation/research;
- execution.
Many teams discover that almost everything they call an “experiment” is execution.
Module 4 — Write hypotheses that can fail
Read Experimentation-Led Go-to-Market.
A useful hypothesis includes:
- target segment;
- intervention;
- expected behavior;
- primary metric;
- guardrail;
- time horizon.
Bad:
Improve onboarding.
Better:
For new self-serve teams, showing the setup checklist immediately after signup will increase the share reaching the first collaborative project within 24 hours, without reducing 14-day retention.
Exercise
Write three hypotheses.
Then ask:
If this test is negative, what will we learn?
If the answer is “nothing,” rewrite the hypothesis.
Module 5 — Build the experimentation stack
Read Experimentation & CRO Stack: How to Turn User Behavior Into Measurable Growth.
The stack should connect:
- behavioral evidence;
- hypothesis backlog;
- controlled delivery;
- primary and guardrail metrics;
- analysis;
- rollout;
- knowledge storage.
Do not buy experimentation software before the team has a hypothesis process.
Exercise
Audit your current system.
Where does each item live?
- insight;
- hypothesis;
- design;
- implementation;
- result;
- decision;
- learning.
Identify where information is lost.
Module 6 — Study iterative experimentation
Read TruckersReport: Six CRO Tests That Lifted Landing Page Conversion 79.3%.
The important lesson is not the historical 79.3% result.
It is that several plausible best practices lost.
The team learned from each round.
This is what a real experimentation program does:
`test → learning → next hypothesis`
rather than:
`test → winner screenshot → forget`
Exercise
Create an experiment record template containing:
- ID;
- hypothesis;
- evidence;
- audience;
- primary metric;
- guardrails;
- result;
- interpretation;
- next question.
Module 7 — Study local vs. global optimization
Read Smartlook: Why a 70%+ Signup Conversion Rate Was Not the Metric That Mattered.
Smartlook’s signup completion improved while activation deteriorated.
This illustrates why experiments need metric hierarchy.
Primary local metric
The immediate behavior.
Downstream metric
The next meaningful stage.
Guardrail
A measure that protects against damage.
For signup optimization:
- local: signup completion;
- downstream: activation;
- guardrail: support burden or retention.
Exercise
For your three hypotheses, add one downstream metric and one guardrail.
Module 8 — Know when the problem requires a strategic pivot
Read Pangea: When a Retention Problem Forced a Business Model Pivot.
Some problems cannot be solved through interface optimization.
If the retention curve is structurally weak, the hypothesis may need to move up a level:
- audience;
- use case;
- product;
- pricing;
- marketplace design;
- business model.
Growth operators need permission to escalate the problem.
Exercise
For the weakest metric in your system, write hypotheses at three levels:
Tactical
- change execution.
Product
- change experience or feature.
Strategic
- change segment, proposition or model.
Module 9 — Connect growth to North Star and input metrics
Reforge separates high-level outcome metrics from the input metrics teams can directly influence.
Amplitude similarly recommends starting from the customer value moment when defining a North Star Metric, then validating that it predicts retention and revenue.
Do not use one metric as a substitute for the full growth model.
Exercise
Define:
North Star / outcome What valuable behavior or economic outcome indicates healthy growth?
Inputs Which behaviors can teams influence this month?
Guardrails What must not deteriorate?
This creates a metric tree.
Final project — Build a growth experiment system

Your final deliverable includes:
Growth model
- one funnel;
- one loop;
- current constraint.
Metric tree
- outcome metric;
- three input metrics;
- two guardrails.
Backlog
At least ten hypotheses, scored by:
- impact;
- uncertainty/confidence;
- effort;
- learning value.
Experiment design
Write one full experiment:
- hypothesis;
- audience;
- treatment;
- primary metric;
- guardrails;
- duration;
- decision rule.
Knowledge loop
Define where completed experiments are stored and how they create the next hypothesis.
Suggested cadence
Day 1: loops
Day 2: loop measurement
Day 3: experimentation vs. optimization
Day 4: hypothesis design
Day 5: TruckersReport and Smartlook cases
Day 6: strategic escalation and Pangea
Day 7: metric tree and final experiment system
What to study next
Move to Measurement & Metrics if your main weakness is confidence in data or metric definitions.
Return to Acquisition Strategies if the growth constraint is new-customer volume.
Return to Funnels & Lifecycle if activation or retention is weak.
The goal of growth is not to run more tests.
It is to create a system that repeatedly converts uncertainty into evidence and evidence into stronger compounding behavior.
Build an experimentation portfolio, not only a backlog
A list of experiments can become biased toward whatever is easy to ship.
A stronger portfolio deliberately balances different kinds of uncertainty.
Conversion experiments
Improve an existing journey.
Examples:
- pricing page;
- checkout;
- onboarding.
Growth-model experiments
Test how one cohort can create the next.
Examples:
- referral;
- content loop;
- partner loop.
Market experiments
Test strategic assumptions.
Examples:
- new ICP;
- new use case;
- new geography;
- new channel.
Monetization experiments
Test:
- packaging;
- price presentation;
- trial structure;
- upgrade paths.
Measurement experiments
Improve confidence in the system itself.
Examples:
- validate activation definition;
- test incrementality;
- reconcile attribution.
Exercise
Take your top 15 backlog items.
Tag each by experiment type.
If more than two-thirds sit in one category, the team may be optimizing one layer while ignoring larger uncertainty elsewhere.
Experiment quality review
Before launch, ask:
- Is the hypothesis falsifiable?
- Is there enough traffic or sample opportunity?
- Is the primary metric close enough to the intended value?
- Are guardrails defined?
- Could another concurrent change contaminate the result?
- What decision changes if the result is positive?
- What decision changes if it is negative?
- Is the learning worth the implementation cost?
A test with no decision consequence is usually a weak test.
The strongest programs optimize for decision quality, not experiment count.